Article: Practical advantages of R language in Web Analytics and Data Science
Main Questions Addressed in This Article
- A Brief Introduction to Google Analytics as a Data Source for Data Science
- The Presentation of the R Language and Its Relevant Libraries in the Context of Google Analytics
- Challenges Related to Google Analytics Sampling and Data Collection
(This is the future article: An Introduction to Exploratory Data Analysis (EDA) and Predictive Modeling Using Tidyverse and Tidypredict Libraries in R and Python.)
Explanatory Legend
“ 🙂 Author’s humorous remarks”
Serious comments
1. A Brief Introduction to Google Analytics as a Data Source for Data Science
Google Analytics is a free web tracking service—albeit with certain limitations—that allows users to monitor visitor behavior on a website. The Google Analytics code snippet can be implemented in various ways: it can be hard-coded within the <head>…</head> tags of each web page, integrated using Google Tag Manager, or added as a plugin in content management systems (some of which are free, like those designed for WordPress, while others are not).
Since its initial release in 2005, Google Analytics has gained widespread popularity. However, as usage scales up, it can introduce additional challenges. In its standard form, Google Analytics offers a limit of 10 million hits per month for a single property. This limitation can result in data being sampled, which may lead to potentially inaccurate results when extrapolating findings from a limited dataset.
This sampling issue is one of the factors that may drive businesses to consider the premium edition, known as GA360. However, it’s worth noting that GA360 comes with a substantial cost and may not be a viable option for everyone.
At this critical juncture, the R language proves to be a valuable asset. With a relatively concise query code, we can tap into the Google API and retrieve unsampled data in smaller quantities. This allows us to programmatically compile and generate datasets that are compatible with various Business Intelligence (BI) tools.
An additional advantage of utilizing the API—as opposed to solely relying on Google Analytics web interface dashboards—is the ability to merge reports that are not readily available “out of the box.” Furthermore, we can incorporate “offline” data to gain insights into a user’s complete purchasing journey.
Lastly, leveraging Google Analytics raw data as a source for predictive analytics offers a valuable opportunity.
In the following sections, we will explore these pivotal elements, consider their practical benefits, and even propose potential solutions to meet customer needs.
2. The Presentation of the R Language and Its Relevant Libraries in the Context of Google Analytics
(Wikipedia citation with comments: “R is a language built for the specific purpose of statistical calculations in 1993. It is strictly designed for statistics and data science. It’s open-source and is actually the best suite for statisticians and probably a good choice for data scientists. R is putting utmost effort to walk parallelly to Python.”) I would also add that many Python libraries were implicitly imported from the R language.
R has the richest selection of relevant libraries: over 12,000 packages are available on the official CRAN repository, making nearly any kind of data analysis possible! Both R and Python can handle significant amounts of data, and each has its own advantages and disadvantages.
The R language is built into Microsoft Power BI—it’s one of the best ways to build sophisticated data models in Power BI.
We have all encountered issues where data manipulation was not straightforward in Power BI alone, or even impossible.

R language is not any worse or any better than Python. I would hardly insist that such kind of comparison is neither applicable nor professional. Both languages can often do nearly the same job but with different grades of efficiency in particular domains. R is perfect for Statistics, Web Analytics, Data Visualization and is very efficient in Google Analytics Reporting API calls!
“For instance, the authorization on Google Analytics Reporting API (for collection of Google Analytics metrics and dimensions is made by the only one short line of R-code:
rga_auth <- authorize(client.id = “***.apps.googleusercontent.com”, client.secret = “***”)”
And there will be a stable connection to Google Analytics API — as the output of this code.
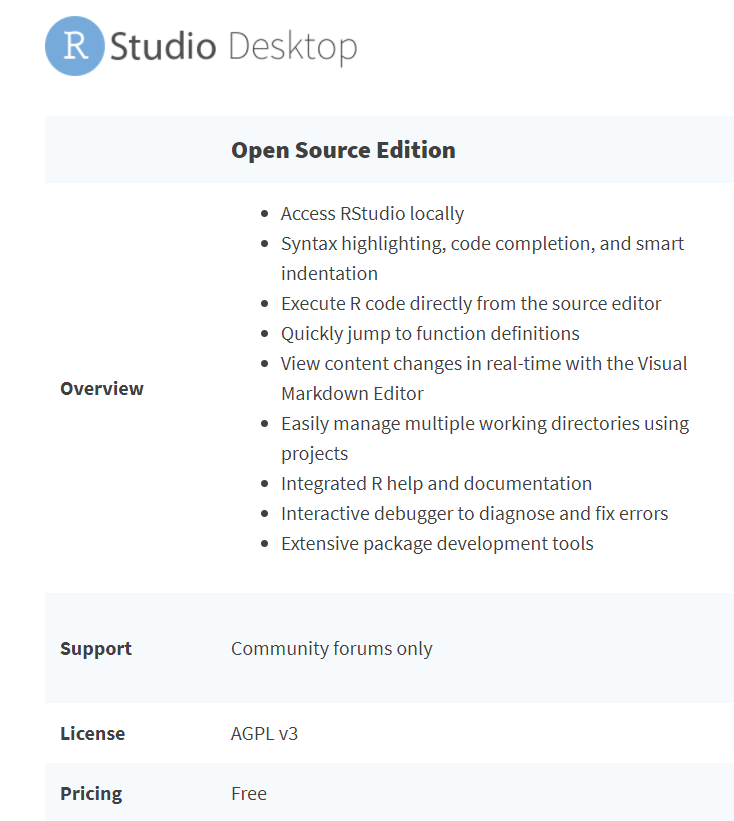
The R programming IDE interface is much simpler to acquire, and there’s only one full-fledged IDE available for R: R-Studio which is fully educational, with plenty of built-in educational packages available for free, such as SWIRL:

Python is a more universal and versatile programming language and is better applicable (in the particular field of Data Science) for Machine Learning.
R is mainly a statistical language by its conception. That’s why so many ‘widespread’ tasks could be easily accomplished through R rather than Python.
# Although many “basis” staff are made nearly identically in R and Python:
For instance, looking at the first 5 rows of the data frame in R:
head (df, 5)
Doing the same thing in Python:
df.head (5)
“ 🙂 Should anyone doubt the effectiveness of knocking nails with a smartphone while a hammer is made exactly for that? Such an assumption is even senseless. Each tool for its purpose! No more Holy wars, only the business!”
Necessary precision: harmonic use of R with Python together would render the life of a Data Scientist or a Web Analyst much easier. The second argument would also help save a lot of time & money for the whole business, especially in long-term. Not only because the proper use ratio of both languages would become beneficial. But also because for most people, the basic study of R is a less time-consuming process, an investment of several days into the learning of R could bring its first results sooner and more certainly than if that time would be invested into Python.
# We will soon consider some practical examples from real life in order not to sound unprovable.
The delimitation of duties on these languages can be vague, as many things can be similarly done in R and Python environments.
Python is universally considered as an easy-to-learn language, while R should be regarded as an ‘easy-to-learn language on a fundamental level. That makes a huge difference: from my various experiences, the quick implementation of the R language in parallel with Python or a unique solution could be very advantageous.
The R Ide (R-Studio) is intuitive and informational with all-in-one: Editor, Console, Output (a result of run code) and Information windows.

🙂 I had experimented a lot with the marketing departments. Often the quickness and easiness won out over deepness and complexity.
3. Challenges Related to Google Analytics Sampling and Data Collection
🙂 Thirty minutes of preparation time is sufficient to get started. I have successfully initiated the Google Analytics data collection process in just 30 minutes—and not only that, I have also provided guidance to marketers on how to do it themselves!
In practical, real-world scenarios, the primary motivation—if not the most compelling one—for expeditiously adopting the R language was the need to circumvent Google Analytics sampling. The company had been operating under erroneous assumptions and constructing ineffective models relying on limited data obtained solely from the Google Analytics web interface. These discrepancies evolved into a significant concern for the company, given that numerous decisions were being made exclusively based on GA’s sampled data.
We might need unsampled data only occasionally—for instance, when something serious happens or if we want to dig deeper for a particular task.
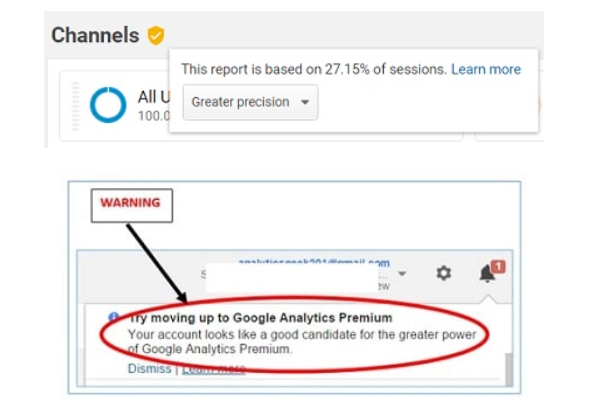
Sampling in Google Analytics is frequently cited as one of the primary reasons for transitioning to the premium edition, known as Google Analytics 360 (GA360). However, it’s worth noting that such sampling issues can be programmatically circumvented at no cost for the majority of tasks and under most circumstances.
The yearly subscription for GA360 can reach $150,000 USD or more, depending on the number of business units connected and data volume, but R tools remain the simplest way to avoid that expense.
Each time you see the yellow-colored indicator in the top left corner of the GA web interface, you cannot rely on the results for building workable models.
So, query partitioning can become an excellent solution, allowing you to save money on premium analytics while retrieving the needed data in an appropriate format—such as a data frame or CSV—that can then be exported into Power BI or other business intelligence tools.
Another key aspect is making API calls with the help of R.
The first R package available was (and still is!) RGA. As the official documentation states:
“Provides functions for accessing and retrieving data from the Google Analytics APIs. Supports OAuth 2.0 authorization. The package includes access to the Management, Core Reporting, Multi-Channel Funnels Reporting, Real-Time Reporting and Metadata APIs. Access to all the Google Analytics accounts to which the user has access. Auto-pagination to return more than 10,000 rows of the results by combining multiple data requests.”
There are some other excellent advantages “behind the scenes.” For instance, you can combine unrelated or unavailable (in the GA web interface) combinations of GA metrics and dimensions. Additionally, custom dimensions can offer further advantages—we will explore these in practical examples later.
But first things first.
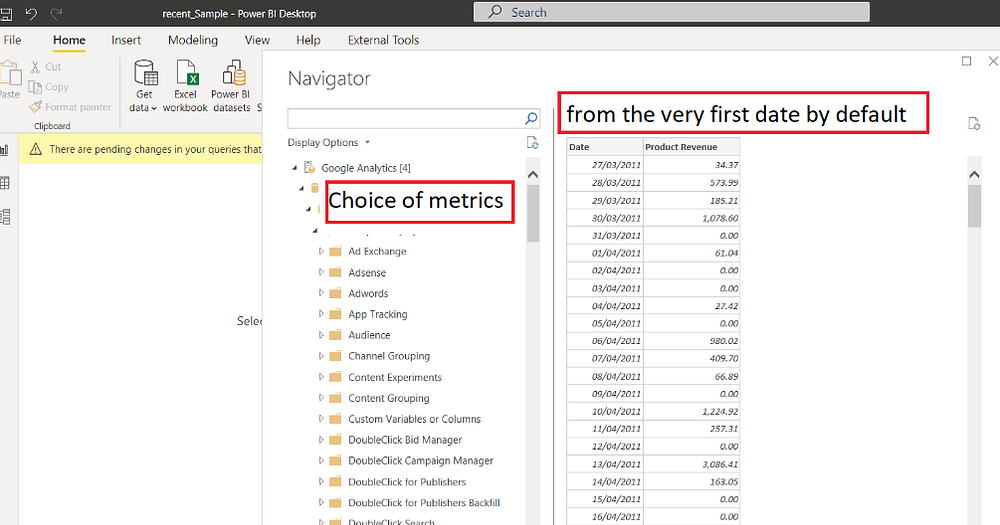
Power BI enables the extraction of metrics and dimensions from Google Analytics. However, based on experience, it performs optimally when dealing with small projects that have a reasonable number of sessions and hits. One notable aspect is that Power BI automatically retrieves data from the project’s inception date—as illustrated in the example below—which corresponds to the date when the GA tracker was implemented. The inability to select a specific date may not be a significant concern for small businesses but could be crucial for medium-sized or larger enterprises.
Additionally, it can be only a matter of time before issues arise: the connection between the API and the host is often lost, requiring the user to manually restart the query. In short, it’s not a reliable or functional solution.
So, let’s start with an actual use case.
# We should understand which campaign and source/medium was the most influential on assisted conversions of a particular user during the last several years.
Kind of attribution modelling. Costly staff if ordered elsewhere.
# The Company was getting a higher number of sessions/hits than allowed by Google on a “no-sampling basis” but didn’t want to pay a yearly amount of USD 150K for GA-360. The Power BI connector didn’t work for them; neither R-script could run from within Power BI.
They also wanted to combine metrics and dimensions from different Google API (which was impossible to do in GA Web Interface) to build one colossal Report based on the following list of dimensions and metrics:
MCF (Multi-Channel-Funnel):
dimensions = “mcf:conversionDate, mcf:source, mcf:medium, mcf:transactionId”,
metrics = “mcf:assistedconversions, mcf:assistedvalue”,
GA Core API :
dimensions = “ga:date, ga:transactionId, ga:dimension6, ga:medium, ga:campaign”,
metrics = “ga:sessions, ga:hits, ga:transactions, ga:transactionRevenue”,
dimension6 — was a newly created GA custom dimension for User ID
One dimension in common was: ga:transactionId
What we’ve done so far:
- We installed R-language on the local machine : The R Project for Statistical Computing (r-project.org)
- We then installed R-Studio (IDE for R-programming), free version: RStudio
3) And we downloaded and activated the minimum list of valuable libraries (called “packages” in R) to do the job:
install.packages(‘RGA’)
# That is the most important R-library providing the set of needed functions for accessing Google API
install.packages(‘dplyr’) # Library facilitating the math operations on data frames
install.packages(“googleAnalyticsR”) # Alternative library for accessing the Google API v.4
install.packages(‘openxlsx’) # Library for creating Excel file out of dataframe
install.packages(‘authorise’) # Library for authentication, saving credentials for further re-use
install.packages(‘reticulate’) # R interface for Python modules, classes and functions
install.packages(‘tidyverse’) # Collection of R-packages for Data Science
and then.. a couple of educational ones (we never know!)
install.packages (‘swirl’) # Comprehensive set of learning step-by-step materials, all inside R IDE
install.packages(‘learnr’) # Collection of interactive tutorials for R language
# Important thing: in R, that’s not enough to download packages. We must also attach, say import them each time we want to run the code (in case if a code is supposed to use these particular packages)
The code down below is installing packages only. So they must be attached / activated to every instance of API call by doing ‘library (RGA)’

Now we will quickly go through the process:
getwd() # Check the current working directory
The output could be any active directory, such as: D:/TEST_DIR
setwd(“D:/TEST_DIR”) # Setting the new working directory if the current directory is not the one needed
getwd() # double check if the working directory was set OK
# AUTHORIZATION process on Google API
rga_auth <- authorize(client.id = “12345-nnnnnnnn.apps.googleusercontent.com”, client.secret = “nBn12345”) # Client ID and Client secret from Google Cloud Platform
Then if we want to know the list of accounts and possibly save it into a variable for further re-use:
list_accounts() # GETTING THE FULL LIST OF GA ACCOUNTS — IN ORDER TO KNOW THE ACCOUNT ID (FOR MANY PURPOSES)
- the output will appear in the console in the format of a ‘tibble’ with the precise information about :

So the Query code should look something like:
ga_data <- get_ga (“profile_id”, start.date = first_date (could be a variable or a real date),
end.date = “today”, metrics = “ga:sessions”, dimensions = “ga:source,ga:medium”, sort = “-ga:sessions”) ## End(Not run)
The working query example, where we combine basic Google Analytics dimensions with custom dimension (dimension 6 which is the Client ID) and some useful metrics.
We set the Sampling Level to ‘HIGHER_PRECISION’ in case the sampling is an issue

Output of that code will be the table, which we can easily convert into the excel file by the line of that R-code:
write.xlsx(GA_conversions, file = “Ga_conversions.xlsx”)

Same table converted into Excel:

And.. once again, the output file will be stored in ACTIVE directory,
To check which directory is now Active, we may use the following code:
active_directory <- getwd() # by that, we create a variable active_directory where the location will be stored
Once we call the variable active_directory, we will get the following result:
> active_directory
[1] “C:/EXPERIMENTS”
We should keep in mind that the newer R-package called ‘googleAnalyticsR’ is considered by many to work better and faster with Google Analytics API v4, but from my experience — NOT necessarily so.
Also, very importantly: the daytime connection may represent an issue as well.
# Why?
Most of Google Analytics servers are physically located in the USA (earlier time zone compared to Europe) so, the best moment to try fast querying was usually the European morning hours (which corresponds to the nighttime in the US)
RGA (RGA.pdf (r-project.org) is still doing a great job both on API v.3 and API v.4 as well.
# Occasionally, in my practice activity, I encountered technical issues (unexpected losses of connection most often), so the good thing is to reduce the time period.
For instance, in the code example, I’ve mentioned we are taking the whole month for the querying. However, on more ‘loaded’ projects, I used to limit (fetch) by ONE day: I will show you soon how to bind the results quickly.
But before we bind the query results, I would like to add some more Magic into the process.
Something impossible to get by only Google Analytics Web Interface but that could be done ‘Free of charge’ using R. I am talking about combining/joining query results of calling Google Analytics Core API and Multi-Funnel API in parallel.
We can’t get that kind of reports/ metrics & dimensions altogether. Google Analytics is not allowing us to do that!
But what if our business requires to know the Revenue by a particular ‘assisted conversion’ made by a specific Client? (we’ve previously hardcoded the custom dimension number x strictly for that eventual purpose)
# We could also sort by Medium or Segment by Condition.
# and adjust the needed sampling level while the most accurate is ‘HUGHER_PRECISION” as it comes from the name, but it can just not work on large volumes!
You may also play with “DEFAULT” and “FASTER” modes which are not necessarily worse: often, it is only a matter of how the algorithm performs. So three of them might bring similar results whatsoever.
So, coming back to the query: we now have a few dimensions in common, and if we call both servers (GA server and MCF — multi-channel funnel Server) and then get a magical result, unattainable in Google Analytics “out of the box”.
So the second query should deal with MCF API:

We use the R-function get_mcf to do the job.
# I also recommend using Sys.sleep () R-function to force a pause after each query. To keep it going on quietly.
The further procedures are pretty simple and less technical:
- We need to bind the resulting datasets obtained from both servers.
- Save the bind datasets as RDS (own R data file format), relatively ‘lite weighted and easily transformable to CSV or Excel files.
- Save as CSV.
- Everything is now ready for data modelling in BI tools.
Binding with the rbind() function having monthly datasets as its arguments:

Then saving as RDS:
…and possibly read from that resulting RDS and then write CSV out of the resulting dataset.

CSV files could be way more significant than RDS, so easier to keep RDS stored on local drives. Especially if we talk about hundreds of millions of rows with multiple columns
# R language is using the computer RAM for manipulation, so bigger RAM is better.
And the R language tools are helping to manipulate GA data free of charge, which would otherwise cost an additional 150K for the business, and still these data would not be ready to use. Some programming and modelling would be needed even if the expensive GA-360 is used.
In my opinion (not pretending to be an Expert in that particular field), the solution we are talking about — is something advantageous — especially the anti sampling and for many “low budget”, Companies can be the unique way of getting the best Business decisions for free.
Conclusions
- We managed to use several ‘hidden’ capabilities of Google Analytics: we eliminated so-called sampling (one of the leading advertising arguments for switching to GA premium edition ‘GA-360’). So we saved ‘150K’ for an abstract business if the sampling was a blocking factor.
2. We overpassed sampling programmatically: our data are un-sampled and free.
3. Then we called MCF (Multi-Channel API) for getting new dimensions and metrics (which are not parsed together with those of Core API) and bound these independent data together into one resulting data frame and CSV.
4. That was also impossible in a free version of Google Analytics, even impossible in the paid version of Google Analytics.
R language has plenty of useful libraries such as ‘Tydiverse’ or ‘Tydipredict’ helping to make business Predictions and perform an Exploratory Data Analysis. We could use any publicly available datasets or even the un-sampled data obtained from Google Analytics to make Exploratory Analysis (using built-in BI capabilities of R). That would definitely be a subject of our next Article.
References:
- e-Book “R for Data Science” 7 Exploratory Data Analysis | R for Data Science (had.co.nz)
- GA Dimensions & Metrics Explorer UA Dimensions & Metrics Explorer (ga-dev-tools.web.app)
- Official documentation of RGA library for R: RGA.pdf (r-project.org)
- Explore mtcars dataset (r-project.org)
- Run Predictions Inside the Database • tidypredict (tidymodels.org)